TEAM SHOT CHARTS
We have shot location data going back through the 2019/20 BBL season. You can compare shooting between teams (or the league average) across these seasons below.
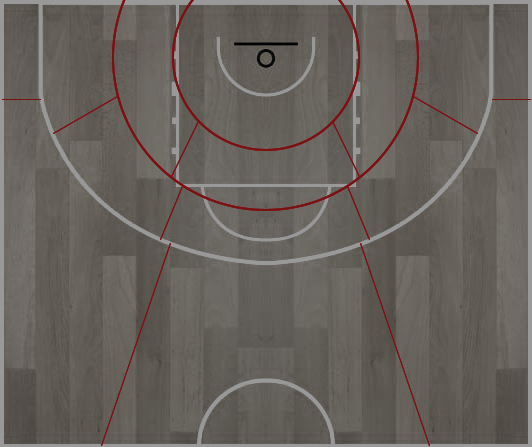
49.5% % of a team's total FGAs from that zone
56.4% team's field goal %, above | below BBL average
52.0%
54.1%
54.1%
1.8%
32.5%
32.5%
1.3%
23.3%
23.3%
4.2%
27.7%
27.7%
0.4%
20.0%
20.0%
0.5%
16.7%
16.7%
0.4%
40.0%
40.0%
0.4%
40.0%
40.0%
0.8%
38.9%
38.9%
2.1%
36.2%
36.2%
1.6%
28.6%
28.6%
13.4%
38.0%
38.0%
11.4%
31.1%
31.1%
9.6%
26.9%
26.9%
Bristol Flyers | Shot Distribution (Offensive)
SLB Season 25/26
47.8%
56.8%
56.8%
4.4%
39.6%
39.6%
1.1%
40.6%
40.6%
2.0%
40.3%
40.3%
0.7%
43.4%
43.4%
1.0%
32.8%
32.8%
2.1%
32.5%
32.5%
0.8%
32.9%
32.9%
1.0%
36.4%
36.4%
9.2%
33.2%
33.2%
3.1%
38.0%
38.0%
12.8%
36.0%
36.0%
2.3%
36.4%
36.4%
11.6%
33.4%
33.4%
League Averages | Shot Distribution (Offensive)
SLB Season 25/26
44.0%
54.7%
54.7%
2.1%
45.7%
45.7%
1.6%
25.0%
25.0%
4.0%
34.8%
34.8%
1.0%
47.8%
47.8%
0.8%
41.2%
41.2%
0.9%
40.0%
40.0%
1.1%
32.0%
32.0%
1.4%
48.4%
48.4%
2.7%
50.8%
50.8%
2.7%
39.0%
39.0%
13.7%
38.7%
38.7%
12.9%
32.6%
32.6%
11.0%
34.3%
34.3%
Bristol Flyers | Shot Distribution (Defensive)
SLB Season 25/26
47.8%
56.8%
56.8%
4.4%
39.6%
39.6%
1.1%
40.6%
40.6%
2.0%
40.3%
40.3%
0.7%
43.4%
43.4%
1.0%
32.8%
32.8%
2.1%
32.5%
32.5%
0.8%
32.9%
32.9%
1.0%
36.4%
36.4%
9.2%
33.2%
33.2%
3.1%
38.0%
38.0%
12.8%
36.0%
36.0%
2.3%
36.4%
36.4%
11.6%
33.4%
33.4%
League Averages | Shot Distribution (Defensive)
SLB Season 25/26