SHEFFIELD SHARKS
BBL Rankings
| Stat | Score | Rank |
|---|---|---|
| PPG | 84.23 | 5 |
| ORTG | 111.28 | 5 |
| FG% | 47.09 | 2 |
| 3P% | 36.99 | 1 |
| FT% | 69.91 | 7 |
| FTR | 32.96 | 2 |
| TS% | 56.79 | 3 |
| OR% | 28.38 | 8 |
| AST% | 58.64 | 6 |
| TO% | 14.54 | 4 |
| Stat | Score | Rank |
|---|---|---|
| PPG | 83.88 | 3 |
| DRTG | 110.82 | 5 |
| FG% | 43.47 | 2 |
| 3P% | 34.81 | 3 |
| FT% | 72.30 | 7 |
| FTR | 30.69 | 6 |
| TS% | 54.81 | 3 |
| DR% | 71.50 | 4 |
| AST% | 64.44 | 9 |
| TO% | 13.33 | 7 |
Roster
| Firstname | Lastname | # | Position | Height | Age | Nation | G | MIN |
|---|---|---|---|---|---|---|---|---|
| Fahro | Alihodzic | 25 | C | 6'9 | 36 | GBR | 4 | 75 |
| Rodney | Chatman | 3 | G | 6'1 | 27 | USA | 25 | 597 |
| Jalen | Deloach | 23 | F | 6'9 | 0 | USA | 20 | 371 |
| Rodney | Glasgow Jr | 11 | G | 5'11 | 32 | USA | 26 | 406 |
| Mervin | James | 5 | F | 6'7 | 24 | USA | 13 | 319 |
| Nick | Kern Jr | 24 | G | 6'6 | 0 | USA | 25 | 534 |
| William | Lee | 4 | F | 6'9 | 30 | USA | 25 | 551 |
| Prentiss | Nixon | 2 | G | 6'2 | 28 | USA | 21 | 519 |
| Mike | Ochereobia | 15 | C | 6'8 | 36 | GBR | 25 | 348 |
| Jordan | Ratinho | 9 | G | 6'5 | 27 | USA/POR | 26 | 648 |
| Reyad | West | 6 | F | 6'5 | 24 | GBR | 3 | 5 |
| Dirk | Williams | 1 | G | 6'5 | 31 | USA | 26 | 827 |
Team Shot Distribution (Offensive)
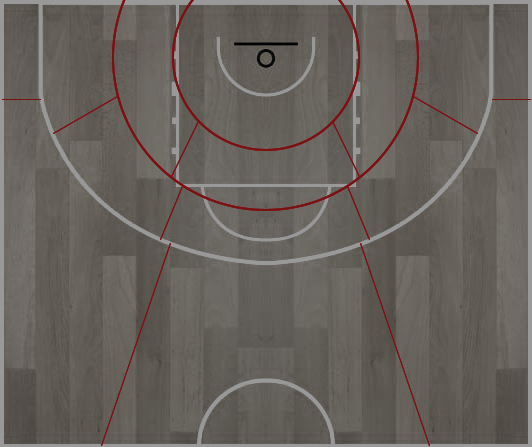
471/841
56.0%
56.0%
24/43
55.8%
55.8%
10/35
28.6%
28.6%
24/72
33.3%
33.3%
4/11
36.4%
36.4%
7/16
43.8%
43.8%
12/25
48.0%
48.0%
11/27
40.7%
40.7%
14/31
45.2%
45.2%
14/35
40.0%
40.0%
9/30
30.0%
30.0%
73/178
41.0%
41.0%
62/176
35.2%
35.2%
58/164
35.4%
35.4%
Sheffield Sharks | Shot Distribution (Offensive)
BBL Season 25/26
Team Shot Distribution (Defensive)
422/780
54.1%
54.1%
6/24
25.0%
25.0%
14/40
35.0%
35.0%
26/68
38.2%
38.2%
5/11
45.5%
45.5%
5/15
33.3%
33.3%
9/23
39.1%
39.1%
4/11
36.4%
36.4%
3/11
27.3%
27.3%
24/49
49.0%
49.0%
12/33
36.4%
36.4%
92/275
33.5%
33.5%
71/233
30.5%
30.5%
69/180
38.3%
38.3%
Sheffield Sharks | Shot Distribution (Defensive)
BBL Season 25/26
Averages
-
Per Game
Name G MPG PPG FG% 2P% 3P% FT% ORPG DRPG TRPG APG TOPG SPG BPG FPG Fahro Alihodzic 4 18.65 7.25 66.67 66.67 0.00 45.45 2.00 3.50 5.50 1.75 1.25 2.25 0.00 3.25 Rodney Chatman 25 23.90 12.92 39.43 41.13 37.14 78.95 0.44 2.64 3.08 4.72 2.28 1.16 0.16 2.24 Jalen Deloach 20 18.57 7.80 60.61 66.28 23.08 49.25 1.45 3.85 5.30 1.40 1.45 0.40 0.75 2.65 Rodney Glasgow Jr 26 15.60 3.88 41.84 49.18 29.73 100.00 0.23 0.88 1.12 1.19 0.58 0.31 0.08 0.62 Mervin James 13 24.57 15.54 45.40 47.79 33.33 81.82 1.54 5.62 7.15 1.15 2.38 0.46 0.38 1.92 Nick Kern Jr 25 21.35 11.64 52.07 55.56 15.79 60.19 1.12 2.96 4.08 2.20 1.80 0.56 0.40 2.24 William Lee 25 22.04 9.28 53.99 61.80 44.59 67.65 1.24 5.64 6.88 0.92 0.84 0.88 1.32 2.12 Prentiss Nixon 21 24.71 13.14 39.22 44.00 33.64 87.88 0.38 2.67 3.05 3.95 1.81 0.71 0.05 1.76 Mike Ochereobia 25 13.92 3.72 61.54 61.54 0.00 52.00 1.88 1.20 3.08 0.28 0.80 0.28 0.08 2.32 Jordan Ratinho 26 24.93 4.12 43.48 50.00 36.96 55.56 1.12 1.81 2.92 1.12 0.77 0.88 0.23 2.04 Reyad West 3 1.80 1.33 100.00 100.00 0.00 100.00 0.00 0.00 0.00 0.00 0.67 0.00 0.00 0.00 Dirk Williams 26 31.79 14.46 46.90 52.99 41.67 75.00 0.38 3.58 3.96 2.65 1.27 0.92 0.85 1.73 -
Per 40min
Name G MINS PP40 FG% 2P% 3P% FT% ORP40 DRP40 TRP40 AP40 TOP40 SP40 BP40 FP40 Fahro Alihodzic 4 75 15.55 66.67 66.67 0.00 45.45 4.29 7.51 11.80 3.75 2.68 4.83 0.00 6.97 Rodney Chatman 25 597 21.63 39.43 41.13 37.14 78.95 0.74 4.42 5.16 7.90 3.82 1.94 0.27 3.75 Jalen Deloach 20 371 16.80 60.61 66.28 23.08 49.25 3.12 8.29 11.42 3.02 3.12 0.86 1.62 5.71 Rodney Glasgow Jr 26 406 9.96 41.84 49.18 29.73 100.00 0.59 2.27 2.86 3.06 1.48 0.79 0.20 1.58 Mervin James 13 319 25.30 45.40 47.79 33.33 81.82 2.50 9.14 11.65 1.88 3.88 0.75 0.63 3.13 Nick Kern Jr 25 534 21.81 52.07 55.56 15.79 60.19 2.10 5.55 7.64 4.12 3.37 1.05 0.75 4.20 William Lee 25 551 16.84 53.99 61.80 44.59 67.65 2.25 10.24 12.49 1.67 1.52 1.60 2.40 3.85 Prentiss Nixon 21 519 21.28 39.22 44.00 33.64 87.88 0.62 4.32 4.93 6.40 2.93 1.16 0.08 2.85 Mike Ochereobia 25 348 10.69 61.54 61.54 0.00 52.00 5.40 3.45 8.85 0.80 2.30 0.80 0.23 6.67 Jordan Ratinho 26 648 6.60 43.48 50.00 36.96 55.56 1.79 2.90 4.69 1.79 1.23 1.42 0.37 3.27 Reyad West 3 5 29.68 100.00 100.00 0.00 100.00 0.00 0.00 0.00 0.00 14.84 0.00 0.00 0.00 Dirk Williams 26 827 18.20 46.90 52.99 41.67 75.00 0.48 4.50 4.98 3.34 1.60 1.16 1.06 2.18
Shooting
-
Per Game
Name G MPG FGM FGA FG% 2PM 2PA 2P% 3PM 3PA 3P% FTM FTA FT% Fahro Alihodzic 4 18.65 3.00 4.50 66.67 3.00 4.50 66.67 0.00 0.00 0.00 1.25 2.75 45.45 Rodney Chatman 25 23.90 3.88 9.84 39.43 2.32 5.64 41.13 1.56 4.20 37.14 3.60 4.56 78.95 Jalen Deloach 20 18.57 3.00 4.95 60.61 2.85 4.30 66.28 0.15 0.65 23.08 1.65 3.35 49.25 Rodney Glasgow Jr 26 15.60 1.58 3.77 41.84 1.15 2.35 49.18 0.42 1.42 29.73 0.31 0.31 100.00 Mervin James 13 24.57 5.69 12.54 45.40 5.00 10.46 47.79 0.69 2.08 33.33 3.46 4.23 81.82 Nick Kern Jr 25 21.35 4.52 8.68 52.07 4.40 7.92 55.56 0.12 0.76 15.79 2.48 4.12 60.19 William Lee 25 22.04 3.52 6.52 53.99 2.20 3.56 61.80 1.32 2.96 44.59 0.92 1.36 67.65 Prentiss Nixon 21 24.71 4.33 11.05 39.22 2.62 5.95 44.00 1.71 5.10 33.64 2.76 3.14 87.88 Mike Ochereobia 25 13.92 1.60 2.60 61.54 1.60 2.60 61.54 0.00 0.00 0.00 0.52 1.00 52.00 Jordan Ratinho 26 24.93 1.54 3.54 43.48 0.88 1.77 50.00 0.65 1.77 36.96 0.38 0.69 55.56 Reyad West 3 1.80 0.33 0.33 100.00 0.33 0.33 100.00 0.00 0.00 0.00 0.67 0.67 100.00 Dirk Williams 26 31.79 5.23 11.15 46.90 2.73 5.15 52.99 2.50 6.00 41.67 1.50 2.00 75.00 -
Per 40min
Name G MINS FGM FGA FG% 2PM 2PA 2P% 3PM 3PA 3P% FTM FTA FT% Fahro Alihodzic 4 75 6.43 9.65 66.67 6.43 9.65 66.67 0.00 0.00 0.00 2.68 5.90 45.45 Rodney Chatman 25 597 6.49 16.47 39.43 3.88 9.44 41.13 2.61 7.03 37.14 6.03 7.63 78.95 Jalen Deloach 20 371 6.46 10.66 60.61 6.14 9.26 66.28 0.32 1.40 23.08 3.55 7.22 49.25 Rodney Glasgow Jr 26 406 4.04 9.66 41.84 2.96 6.01 49.18 1.08 3.65 29.73 0.79 0.79 100.00 Mervin James 13 319 9.27 20.41 45.40 8.14 17.03 47.79 1.13 3.38 33.33 5.64 6.89 81.82 Nick Kern Jr 25 534 8.47 16.26 52.07 8.24 14.84 55.56 0.22 1.42 15.79 4.65 7.72 60.19 William Lee 25 551 6.39 11.83 53.99 3.99 6.46 61.80 2.40 5.37 44.59 1.67 2.47 67.65 Prentiss Nixon 21 519 7.01 17.88 39.22 4.24 9.64 44.00 2.78 8.25 33.64 4.47 5.09 87.88 Mike Ochereobia 25 348 4.60 7.47 61.54 4.60 7.47 61.54 0.00 0.00 0.00 1.49 2.87 52.00 Jordan Ratinho 26 648 2.47 5.68 43.48 1.42 2.84 50.00 1.05 2.84 36.96 0.62 1.11 55.56 Reyad West 3 5 7.42 7.42 100.00 7.42 7.42 100.00 0.00 0.00 0.00 14.84 14.84 100.00 Dirk Williams 26 827 6.58 14.03 46.90 3.44 6.49 52.99 3.15 7.55 41.67 1.89 2.52 75.00 -
Totals
Name G MINS FGM FGA FG% 2PM 2PA 2P% 3PM 3PA 3P% FTM FTA FT% Fahro Alihodzic 4 75 12 18 66.67 12 18 66.67 0 0 0.00 5 11 45.45 Rodney Chatman 25 597 97 246 39.43 58 141 41.13 39 105 37.14 90 114 78.95 Jalen Deloach 20 371 60 99 60.61 57 86 66.28 3 13 23.08 33 67 49.25 Rodney Glasgow Jr 26 406 41 98 41.84 30 61 49.18 11 37 29.73 8 8 100.00 Mervin James 13 319 74 163 45.40 65 136 47.79 9 27 33.33 45 55 81.82 Nick Kern Jr 25 534 113 217 52.07 110 198 55.56 3 19 15.79 62 103 60.19 William Lee 25 551 88 163 53.99 55 89 61.80 33 74 44.59 23 34 67.65 Prentiss Nixon 21 519 91 232 39.22 55 125 44.00 36 107 33.64 58 66 87.88 Mike Ochereobia 25 348 40 65 61.54 40 65 61.54 0 0 0.00 13 25 52.00 Jordan Ratinho 26 648 40 92 43.48 23 46 50.00 17 46 36.96 10 18 55.56 Reyad West 3 5 1 1 100.00 1 1 100.00 0 0 0.00 2 2 100.00 Dirk Williams 26 827 136 290 46.90 71 134 52.99 65 156 41.67 39 52 75.00
Rebounding
-
Per Game / Per 40m / Reb%
Name G MINS MPG OREB ORPG ORP40 OR% DREB DRPG DRP40 DR% TREB TRPG TRP40 TR% Fahro Alihodzic 4 75 18.65 8 2.00 4.29 14.06 14 3.50 7.51 23.10 22 5.50 11.80 18.73 Rodney Chatman 25 597 23.90 11 0.44 0.74 2.22 66 2.64 4.42 12.32 77 3.08 5.16 7.47 Jalen Deloach 20 371 18.57 29 1.45 3.12 9.37 77 3.85 8.29 22.57 106 5.30 11.42 16.29 Rodney Glasgow Jr 26 406 15.60 6 0.23 0.59 1.78 23 0.88 2.27 6.29 29 1.12 2.86 4.13 Mervin James 13 319 24.57 20 1.54 2.50 7.20 73 5.62 9.14 25.45 93 7.15 11.65 16.48 Nick Kern Jr 25 534 21.35 28 1.12 2.10 6.32 74 2.96 5.55 15.32 102 4.08 7.64 11.01 William Lee 25 551 22.04 31 1.24 2.25 6.87 141 5.64 10.24 28.09 172 6.88 12.49 18.04 Prentiss Nixon 21 519 24.71 8 0.38 0.62 1.81 56 2.67 4.32 12.23 64 3.05 4.93 7.12 Mike Ochereobia 25 348 13.92 47 1.88 5.40 16.33 30 1.20 3.45 9.65 77 3.08 8.85 12.87 Jordan Ratinho 26 648 24.93 29 1.12 1.79 5.40 47 1.81 2.90 8.04 76 2.92 4.69 6.78 Reyad West 3 5 1.80 0 0.00 0.00 0.00 0 0.00 0.00 0.00 0 0.00 0.00 0.00 Dirk Williams 26 827 31.79 10 0.38 0.48 1.46 93 3.58 4.50 12.48 103 3.96 4.98 7.20
Assists & Turnovers
-
Per Game / Per 40m / AST% / TO% / AST:TO
Name G MINS MPG AST APG AP40 AST% TO TOPG TOP40 TO% AST:TO Fahro Alihodzic 4 75 18.65 7 1.75 2.68 15.93 5 1.25 2.68 17.96 1.40 Rodney Chatman 25 597 23.90 118 4.72 3.82 32.89 57 2.28 3.82 16.14 2.07 Jalen Deloach 20 371 18.57 28 1.40 3.12 12.29 29 1.45 3.12 18.42 0.97 Rodney Glasgow Jr 26 406 15.60 31 1.19 1.48 11.55 15 0.58 1.48 12.87 2.07 Mervin James 13 319 24.57 15 1.15 3.88 8.29 31 2.38 3.88 14.21 0.48 Nick Kern Jr 25 534 21.35 55 2.20 3.37 18.56 45 1.80 3.37 14.64 1.22 William Lee 25 551 22.04 23 0.92 1.52 6.90 21 0.84 1.52 10.55 1.10 Prentiss Nixon 21 519 24.71 83 3.95 2.93 27.27 38 1.81 2.93 12.71 2.18 Mike Ochereobia 25 348 13.92 7 0.28 2.30 3.14 20 0.80 2.30 20.83 0.35 Jordan Ratinho 26 648 24.93 29 1.12 1.23 6.39 20 0.77 1.23 16.68 1.45 Reyad West 3 5 1.80 0 0.00 14.84 0.00 2 0.67 14.84 51.55 0.00 Dirk Williams 26 827 31.79 69 2.65 1.60 13.96 33 1.27 1.60 9.54 2.09
Steals & Blocks
-
Per Game / Per 40m / STL% / BLK%
Name G MINS MPG STL SPG SP40 STL% BLK BPG BP40 BLK% Fahro Alihodzic 4 75 18.65 9 2.25 4.83 6.63 0 0.00 0.00 0.00 Rodney Chatman 25 597 23.90 29 1.16 1.94 2.56 4 0.16 0.27 0.71 Jalen Deloach 20 371 18.57 8 0.40 0.86 1.13 15 0.75 1.62 4.30 Rodney Glasgow Jr 26 406 15.60 8 0.31 0.79 1.04 2 0.08 0.20 0.52 Mervin James 13 319 24.57 6 0.46 0.75 0.98 5 0.38 0.63 1.65 Nick Kern Jr 25 534 21.35 14 0.56 1.05 1.38 10 0.40 0.75 2.00 William Lee 25 551 22.04 22 0.88 1.60 2.11 33 1.32 2.40 6.30 Prentiss Nixon 21 519 24.71 15 0.71 1.16 1.52 1 0.05 0.08 0.21 Mike Ochereobia 25 348 13.92 7 0.28 0.80 1.07 2 0.08 0.23 0.61 Jordan Ratinho 26 648 24.93 23 0.88 1.42 1.88 6 0.23 0.37 0.98 Reyad West 3 5 1.80 0 0.00 0.00 0.00 0 0.00 0.00 0.00 Dirk Williams 26 827 31.79 24 0.92 1.16 1.53 22 0.85 1.06 2.82
Advanced & Other Stats
-
Advanced / Other Stats
Name G MINS MPG USG% eFG% TS% +/- ORTG DRTG NET Fahro Alihodzic 4 75 18.65 17.99 66.67 0.635 12 115.08 101.48 13.59 Rodney Chatman 25 597 23.90 27.19 47.36 0.545 2 114.03 110.73 3.30 Jalen Deloach 20 371 18.57 19.27 62.12 0.607 -28 107.77 107.49 0.29 Rodney Glasgow Jr 26 406 15.60 13.24 47.45 0.497 -26 105.43 116.44 -11.01 Mervin James 13 319 24.57 30.77 48.16 0.540 -17 103.09 111.44 -8.35 Nick Kern Jr 25 534 21.35 26.48 52.76 0.555 72 107.67 110.73 -3.06 William Lee 25 551 22.04 16.76 64.11 0.652 28 123.59 102.04 21.55 Prentiss Nixon 21 519 24.71 26.26 46.98 0.529 -7 113.15 114.31 -1.16 Mike Ochereobia 25 348 13.92 12.79 61.54 0.612 45 99.87 114.60 -14.73 Jordan Ratinho 26 648 24.93 8.53 52.72 0.535 -23 104.10 113.47 -9.38 Reyad West 3 5 1.80 33.01 100.00 1.064 -3 93.63 123.27 -29.64 Dirk Williams 26 827 31.79 19.29 58.10 0.601 -10 123.10 111.77 11.33
Averages
-
Per Game vs Opposition & League Averages
Team G PTS FG% 2P% 3P% FT% OREB DREB TREB AST TOS STL BLK FLS Sheffield 26 84.23 47.1 52.5 37.0 69.9 10.35 28.65 39.00 17.88 12.62 6.35 3.85 17.96 Opposition 26 83.88 43.5 50.3 34.8 72.3 11.42 26.12 37.54 18.88 11.77 6.38 3.08 18.04 League Average - 85.23 45.7 52.4 35.2 72.1 11.23 27.17 38.39 18.84 13.00 7.02 2.95 18.40
Shooting
-
Averages per Game vs Opposition & League Averages
Team G FGM FGA FG% 2PM 2PA 2P% 3PM 3PA 3P% FTM FTA FT% Sheffield 26 30.50 64.77 47.1 22.19 42.31 52.5 8.31 22.46 37.0 14.92 21.35 69.9 Opposition 26 29.31 67.42 43.5 19.00 37.81 50.3 10.31 29.62 34.8 14.96 20.69 72.3 League Average - 30.70 67.19 45.7 21.45 40.89 52.4 9.25 26.30 35.2 14.58 20.21 72.1
Rebounding
-
Totals, Averages per Game & Reb%s vs Opposition & League Averages
Team G OREB ORPG OR% DREB DRPG DR% TREB TRPG TR% Sheffield 26 269 10.35 28.38 745 28.65 71.50 1014 39.00 49.94 Opposition 26 297 11.42 28.50 679 26.12 71.62 976 37.54 50.06 League Average - 324 11.22 29.30 785 27.16 70.80 1109 38.38 50.05
| Date | Time | Home Team | Home Score | Away Score | Away Team | W/L | Comp | |
|---|---|---|---|---|---|---|---|---|
| 19/09/25 | 19:30 | Bristol Flyers | 78 | 60 | Sheffield Sharks | L | LGE | Stats |
| 26/09/25 | 19:30 | Leicester Riders | 65 | 93 | Sheffield Sharks | W | LGE | Stats |
| 28/09/25 | 15:00 | Sheffield Sharks | 78 | 73 | Newcastle Eagles | W | LGE | Stats |
| 05/10/25 | 16:00 | Sheffield Sharks | 77 | 71 | Caledonia Gladiators | W | LGE | Stats |
| 12/10/25 | 17:30 | Cheshire Phoenix | 90 | 87 | Sheffield Sharks | L | LGE | Stats |
| 26/10/25 | 17:30 | Cheshire Phoenix | 114 | 95 | Sheffield Sharks | L | LGE | Stats |
| 31/10/25 | 19:30 | Manchester Basketball | 87 | 75 | Sheffield Sharks | L | LGE | Stats |
| 02/11/25 | 16:00 | Sheffield Sharks | 76 | 69 | Bristol Flyers | W | LGE | Stats |
| 07/11/25 | 19:30 | Caledonia Gladiators | 65 | 73 | Sheffield Sharks | W | LGE | Stats |
| 14/11/25 | 19:30 | Newcastle Eagles | 95 | 99 | Sheffield Sharks | W | LGE | Stats |
| 16/11/25 | 16:00 | Sheffield Sharks | 98 | 79 | Manchester Basketball | W | LGE | Stats |
| 05/12/25 | 19:30 | Sheffield Sharks | 68 | 80 | Newcastle Eagles | L | LGE | Stats |
| 12/12/25 | 19:30 | Newcastle Eagles | 94 | 89 | Sheffield Sharks | L | TRO | Stats |
| 14/12/25 | 16:00 | Sheffield Sharks | 90 | 79 | Caledonia Gladiators | W | TRO | Stats |
| 30/12/25 | 19:30 | Sheffield Sharks | 101 | 97 | Cheshire Phoenix | W | LGE | Stats |
| 04/01/26 | 16:00 | Sheffield Sharks | 88 | 94 | Surrey 89ers | L | LGE | Stats |
| 09/01/26 | 19:30 | Manchester Basketball | 84 | 106 | Sheffield Sharks | W | LGE | Stats |
| 16/01/26 | 19:30 | Surrey 89ers | 88 | 77 | Sheffield Sharks | L | LGE | Stats |
| 18/01/26 | 16:00 | Sheffield Sharks | 83 | 92 | London Lions | L | LGE | Stats |
| 25/01/26 | 16:00 | Sheffield Sharks | 100 | 103 | Cheshire Phoenix | L | CUP | Stats |
| 06/02/26 | 19:30 | Bristol Flyers | 77 | 67 | Sheffield Sharks | L | LGE | Stats |
| 08/02/26 | 16:00 | Sheffield Sharks | 77 | 75 | Cheshire Phoenix | W | LGE | Stats |
| 20/02/26 | 19:30 | Caledonia Gladiators | 70 | 92 | Sheffield Sharks | W | LGE | Stats |
| 22/02/26 | 16:00 | Sheffield Sharks | 85 | 94 | Bristol Flyers | L | LGE | Stats |
| 07/03/26 | 19:30 | Sheffield Sharks | 79 | 73 | London Lions | W | LGE | Stats |
| 14/03/26 | 18:00 | Surrey 89ers | 95 | 77 | Sheffield Sharks | L | LGE | Stats |
| 25/03/26 | 19:30 | London Lions | Sheffield Sharks | LGE | ||||
| 29/03/26 | 16:00 | Sheffield Sharks | Surrey 89ers | LGE | ||||
| 03/04/26 | 19:30 | Sheffield Sharks | Leicester Riders | LGE | ||||
| 10/04/26 | 19:30 | Sheffield Sharks | Caledonia Gladiators | LGE | ||||
| 12/04/26 | 16:00 | London Lions | Sheffield Sharks | LGE | ||||
| 17/04/26 | 19:30 | Newcastle Eagles | Sheffield Sharks | LGE | ||||
| 19/04/26 | 16:00 | Sheffield Sharks | Leicester Riders | LGE | ||||
| 26/04/26 | 16:00 | Sheffield Sharks | Manchester Basketball | LGE |